Conceptual –
For illustration / educational purposes only, calculations are based on
"best known assumptions", totals and values are based on current
rules, cost or tables if used and can not be projected with any certain
accuracy due to the unpredictable rules, cost or tax law changes. The amounts
may not reflect any deductions for any charges that may be applicable to any
particular investment for fees, taxes, management or portfolio cost, and is not to be construed as investment, tax
or legal advice. Past performance is not a guarantee of future performance.
Please consult your tax, financial adviser or estate attorney for your personal
situation. Rev.
2012 (a)
 |
| U.S. Aging Population 1 |
 |
| U.S. Aging Population 2 |
 |
| U.S. Aging Population 3 |
 |
| S&P 500 2015 Crash??? |
 |
| Historical S&P 500 |
 |
| S&P 500 The Old Days OR Future? |
 |
| 2008 Crash |
 |
| 2000 Crash |
 |
| GDP - Gross Domestic Product |
 |
| Social Security Benefits and COLA |
 |
| Historical Housing Rates |
 |
| Historical Gold Prices |
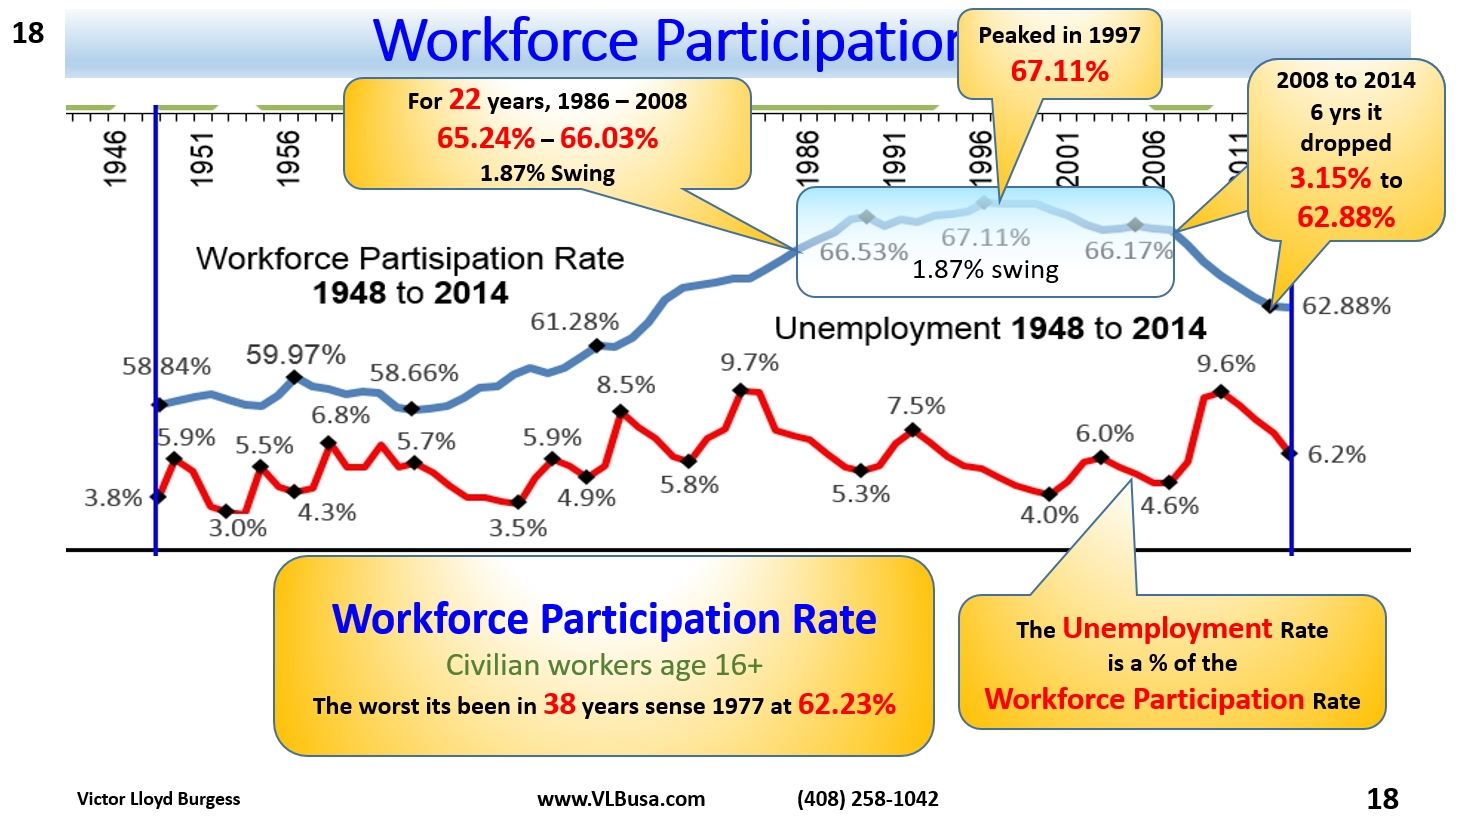 |
| Workforce Rates |
 |
| Top Federal Tax Rates |
 |
| ARR - Annualized vs Average Returns |
 |
| RISK Pyramid |
No comments:
New comments are not allowed.